ILS Investing: What Investors Should Understand | Jonas Osman Abdelghafour
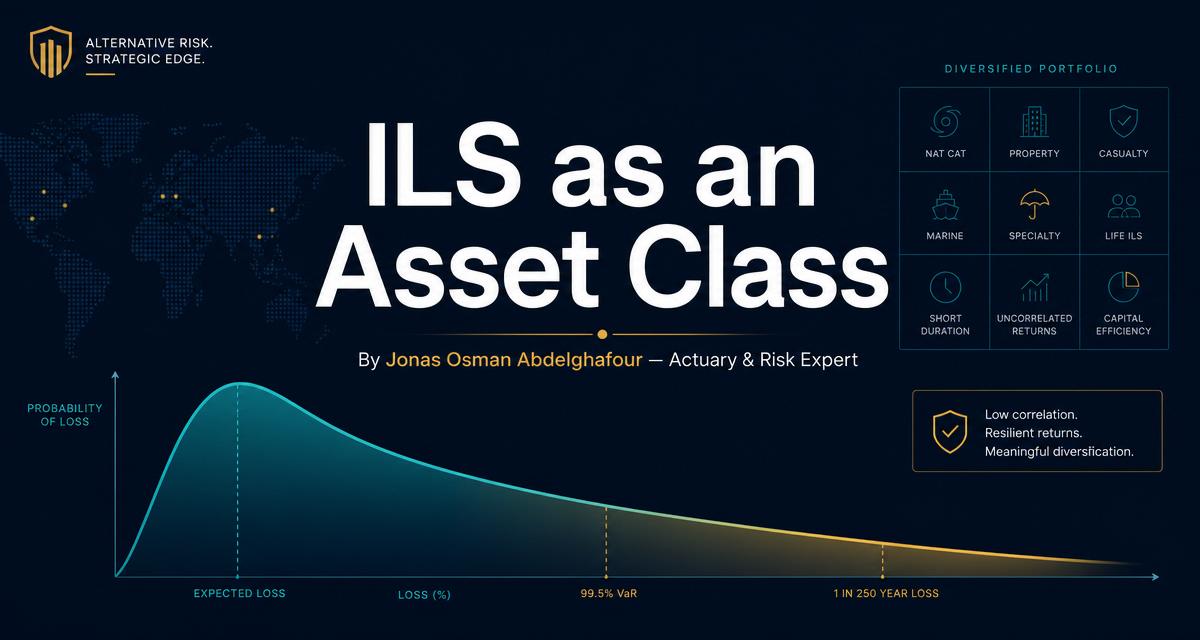
A balanced guide to ILS investing by Jonas Osman Abdelghafour — the diversification thesis, return drivers, negatively skewed risk profile, and the due-diligence questions allocators should ask.
# ILS as an Asset Class: What Investors Should Understand About ILS Investing
*By Jonas Osman Abdelghafour — Actuary & Risk Expert*
Insurance-linked securities have graduated from niche curiosity to a line item in serious institutional portfolios. The pitch for ILS investing is genuinely appealing: returns driven by hurricanes and earthquakes rather than central banks, floating-rate collateral yield, and a risk premium paid by insurers who need capacity. But insurance-linked securities as an asset class have features that reward careful understanding — and punish the lack of it. This article sets out what an allocator should actually know before committing capital: the diversification thesis and its honest caveats, where returns come from, the shape of the risk, and the questions worth asking any manager.
## The diversification thesis — and its honest caveats
The core argument is simple. Whether a hurricane makes landfall in Florida does not depend on equity valuations, credit spreads, or the yield curve. Catastrophe losses are, to a first approximation, uncorrelated with financial markets. That makes ILS one of the few return streams whose primary driver sits genuinely outside the financial system, and it is why the asset class earns a place in diversification discussions at all.
The thesis is broadly sound, but it deserves two honest qualifications.
First, correlation can appear through the plumbing. ILS structures hold collateral, typically in money-market instruments or short-dated government funds. In a severe financial crisis, that collateral is not automatically immune — 2008 demonstrated that money-market assets can wobble precisely when everything else does. The insurance risk stays uncorrelated; the wrapper around it may not. Well-structured funds today hold conservative collateral, but "uncorrelated" should always be read as "uncorrelated in the risk, mostly uncorrelated in the structure."
Second, climate is a common driver across years. Individual events are independent of markets, but a warming climate influences hurricane intensity, wildfire behaviour, and rainfall extremes over time. That does not create correlation with equities — it creates the possibility that historical loss experience understates future loss frequency, which is a different but equally important problem. Diversification against markets is not the same as stationarity of the risk itself.
## Where the returns come from
An ILS return has two components. The first is the collateral yield: invested collateral earns short-term interest, which means ILS is naturally a floating-rate asset. When policy rates are high, that component alone is meaningful; when rates are near zero, it nearly vanishes.
The second — the part investors are actually being paid for — is the risk spread: the premium ceded by insurers and reinsurers in exchange for taking catastrophe risk off their books. A useful mental model compares the spread with the modelled expected loss, the average annual loss the position is projected to suffer over many simulated years. The gap between spread and expected loss is the theoretical risk premium. In hard markets, following major loss years, that gap widens; in soft markets, capital floods in and it compresses. Timing of entry matters more in ILS than the marketing decks tend to admit.
## The shape of the risk: negatively skewed by design
Here is the feature that most often surprises new allocators. ILS returns are negatively skewed: many years of steady, modest gains, punctuated by occasional years of large losses. You collect premium most of the time; every so often, the event you were paid to insure actually happens.
This means the track record of any single fund over a benign stretch tells you relatively little. A strategy can post attractive Sharpe ratios for years while quietly concentrating exposure that produces a severe drawdown in one bad season. Expected loss describes the average; tail risk describes the year that defines your experience of the asset class. An allocator should evaluate ILS on the modelled tail — what happens in the 1-in-100 or 1-in-250 year — not on the recent run of good weather. The dry observation: nobody has ever been surprised by an asset class in the years when nothing happened.
## The key risks allocators should weigh
Several risks deserve explicit attention in any ILS allocation:
- **Model risk.** Returns and risk metrics rest on catastrophe models, which are estimates built from limited historical data. Different vendors produce materially different views of the same portfolio. If the model is wrong, so is your expected loss. - **Aggregation of perils.** A portfolio spread across many positions can still be dominated by one peril — Florida wind, most commonly. Diversification across instruments is not diversification across events. - **Liquidity differences.** Catastrophe bonds trade in a secondary market and can usually be sold, if at a price. Private ILS — collateralised reinsurance, quota shares — is essentially buy-and-hold to contract expiry. Fund liquidity terms should match the underlying assets, and an allocator should verify that they do. - **Trapped collateral.** After a major event, collateral can be held back while ultimate losses are determined, sometimes for years. Capital that is neither lost nor returnable earns little and cannot be redeployed into the attractive post-event market. - **Loss creep.** Catastrophe loss estimates often deteriorate over time as claims develop — Typhoon Jebi in 2018 became a well-known example, with industry estimates rising substantially long after the event. A position marked as a small loss can quietly become a large one. - **Climate-trend uncertainty.** Models calibrated to the historical record may lag a shifting climate. The direction of the error is not symmetric. - **Secondary perils.** Wildfire, severe convective storm, and flood have driven a large share of recent industry losses, and models capture these perils less confidently than hurricane and earthquake. Portfolios with meaningful secondary-peril exposure carry more model risk than headline metrics suggest.
## Due-diligence questions worth asking a manager
A short list that does real work in a manager meeting:
- Which catastrophe models do you use, and where — specifically — do you disagree with them and adjust? - What is the portfolio's modelled loss at 1-in-100 and 1-in-250, by peril and region? What single event hurts most? - How much exposure sits in secondary perils, and how do you price risk the models handle poorly? - How do you reflect climate trend in your view of risk, beyond the vendor default? - What happened to your portfolio in past loss years — including loss creep and trapped collateral, not just the initial mark? - How do fund liquidity terms line up against the liquidity of the underlying instruments? What are the gating provisions? - How are illiquid positions valued after an event, and by whom?
A manager who answers these crisply and admits uncertainty where it exists is worth more than one with a smoother slide deck.
## Sizing and appetite
For most institutional portfolios, ILS is a satellite allocation — commonly low single digits of total assets — sized so that a severe catastrophe year is painful but not plan-altering. The right size depends on liquidity needs, tolerance for negatively skewed outcomes, and the governance stamina to hold through a loss year rather than sell at the bottom, which is historically the worst possible moment given post-event spread widening. If a committee cannot credibly commit to staying invested after a bad season, it should size smaller or not at all.
## The takeaway
ILS investing offers something rare: a risk premium largely disconnected from financial markets, with floating-rate characteristics thrown in. But it is a negatively skewed, model-dependent, sometimes illiquid asset class in which the defining year is the bad one. The diversification thesis holds — with caveats around collateral in a crisis and climate as a slow common driver — and the investors who do well are those who size for the tail, interrogate the models, and enter with eyes open on liquidity. Treat it as insurance economics, not fixed income with a weather theme.
*This article is general information and reflects the author's professional views. It is not investment advice, and no allocation decision should be made on the basis of it alone.*
*Jonas Osman Abdelghafour is an actuary and risk expert who advises insurers, reinsurers, and institutional investors on catastrophe risk, ILS strategy, and portfolio risk management. If your organisation is evaluating an ILS allocation or needs an independent view of a manager or portfolio, contact@jonasosman.org.*